
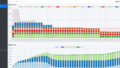
PythonでWebサーバを立てて、グラフを描画する方法を説明します。
Bokehの本家マニュアルが少し分かりにくかったので記事を書いてみました。
Flask+Bokeh+BokehServerで複数のページを実装する方法です
前提条件
・Pythonがインストールされている
・記事ではVisualStudoiCodeを使いますがIDEはお好みで


Pythonライブラリのインストール
必要となるライブラリは以下の3つ
・Flask:軽量なPython用のWebフレームワーク
・Bokeh:インタラクティブなグラフを作成するライブラリ
・Pandas:データ処理のライブラリ(テストデータを利用するために使用)
コマンドプロンプトで以下のコマンドを実行します
> pip install Flask
> pip install bokeh
> pip install Pandas

フォルダ構成
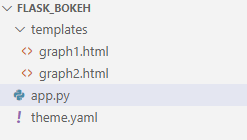
・templates\graph1.html:グラフ1の画面
・templates\graph2.html:グラフ2の画面
・app.py:本体
・thema.yaml:グラフのレイアウト

ソースコード(説明はソース内のコメント見てね)
templates\graph1.html
<html>
<head>
  <title>Flesk+Bokehでグラフ描画1</title>
</head>

<body>
  <div>
    Flesk+Bokehでグラフ描画1
  </div>
  <div>
    <a href="/graph2.html">グラフ2へ</a>
  </div>
  {{ script|safe }}
</body>
</html>
templates\graph1.html
<html>
<head>
  <title>Flesk+Bokehでグラフ描画2</title>
</head>

<body>
  <div>
    Flesk+Bokehでグラフ描画2
  </div>
  <div>
    <a href="/">グラフ1へ</a>
  </div>
  {{ script|safe }}
</body>
</html>
app.py
# ------------------------------------------------------------------
# ライブラリのインポート
# ------------------------------------------------------------------
import asyncio
from threading import Thread

from flask import Flask, render_template
from tornado.httpserver import HTTPServer
from tornado.ioloop import IOLoop

from bokeh.application import Application
from bokeh.application.handlers import FunctionHandler
from bokeh.embed import server_document
from bokeh.layouts import column
from bokeh.models import ColumnDataSource, Slider
from bokeh.plotting import figure
from bokeh.sampledata.sea_surface_temperature import sea_surface_temperature
from bokeh.server.server import BaseServer
from bokeh.server.tornado import BokehTornado
from bokeh.server.util import bind_sockets
from bokeh.themes import Theme

app = Flask(__name__)
# ------------------------------------------------------------------
# グラフ1画面目の描画
# ------------------------------------------------------------------
def graph1(doc):

    # テストデータの準備
    df = sea_surface_temperature.copy()
    source = ColumnDataSource(data=df)

    # テストデータの準備
    plot = figure(x_axis_type='datetime', y_range=(0, 25), y_axis_label='温度 (摂氏)',title="海面水温")
    plot.line('time', 'temperature', source=source)

    # スライダーが変更されたときにコールされるコールバック関数
    def callback(attr, old, new):
        if new == 0:
            data = df
        else:
            data = df.rolling(f"{new}D").mean()
        source.data = ColumnDataSource.from_df(data)

    # スライダーの生成
    slider = Slider(start=0, end=30, value=0, step=1, title="Smoothing by N Days")
    # スライダーにコールバック関数を連携
    slider.on_change('value', callback)

    # スライダーとグラフを出力
    doc.add_root(column(slider, plot))

    # レイアウトをファイルから読み込み
    doc.theme = Theme(filename="theme.yaml")

# ------------------------------------------------------------------
# グラフ2画面目の描画
# ------------------------------------------------------------------
def graph2(doc):

    # テストデータの準備
    df = sea_surface_temperature.copy()
    source = ColumnDataSource(data=df)

    # テストデータの準備
    plot = figure(x_axis_type='datetime', y_range=(0, 25), y_axis_label='温度 (摂氏)',title="海面水温")
    plot.line('time', 'temperature', source=source)

    # スライダーが変更されたときにコールされるコールバック関数
    def callback(attr, old, new):
        if new == 0:
            data = df
        else:
            data = df.rolling(f"{new}D").mean()
        source.data = ColumnDataSource.from_df(data)

    # スライダーの生成
    slider = Slider(start=0, end=30, value=0, step=1, title="Smoothing by N Days")
    # スライダーにコールバック関数を連携
    slider.on_change('value', callback)

    # スライダーとグラフを出力
    doc.add_root(column(slider, plot))

    # レイアウトをファイルから読み込み
    doc.theme = Theme(filename="theme.yaml")

# ------------------------------------------------------------------
# グラフ描画関数のハンドラー定義
# ------------------------------------------------------------------
graph1 = Application(FunctionHandler(graph1))
graph2 = Application(FunctionHandler(graph2))

# ------------------------------------------------------------------
# ブラウザのJavascriptからアクセスするBokehサーバのソケットとポートを取得
# ------------------------------------------------------------------
sockets, port = bind_sockets("localhost", 0)

# ------------------------------------------------------------------
# ブラウザでURL指定でアクセスされたときの処理
# ------------------------------------------------------------------
@app.route('/', methods=['GET'])
def graph1_page():
    script = server_document('http://localhost:%d/graph1' % port)
    return render_template("graph1.html", script=script)

@app.route('/graph2.html', methods=['GET'])
def graph2_page():
    script = server_document('http://localhost:%d/graph2' % port)
    return render_template("graph2.html", script=script)


# ------------------------------------------------------------------
# Bokehサーバ側のワーカー設定
# ------------------------------------------------------------------
def bk_worker():
    asyncio.set_event_loop(asyncio.new_event_loop())
    bokeh_tornado = BokehTornado({'/graph1': graph1,'/graph2': graph2}, extra_websocket_origins=["localhost:5000","127.0.0.1:5000"])
    bokeh_http = HTTPServer(bokeh_tornado)
    bokeh_http.add_sockets(sockets)

    server = BaseServer(IOLoop.current(), bokeh_tornado, bokeh_http)
    server.start()
    server.io_loop.start()

# ------------------------------------------------------------------
# Bokehサーバのスレッドを作成
# ------------------------------------------------------------------
t = Thread(target=bk_worker)
t.daemon = True
t.start()
thema.yaml
attrs:
    Figure:
        background_fill_color: "#DDDDDD"
        outline_line_color: white
        toolbar_location: above
        height: 500
        width: 800
    Grid:
        grid_line_dash: [6, 4]
        grid_line_color: white

コメント